The Quarterly Guide for District Leaders: What Your Q2 Transportation Data Reveals
By Q2, districts are well underway in planning for next school year. Enrollment projections are becoming clear, and as a result, boundary adjustments, program expansions, and schedule changes may already be taking shape.
These conversations typically happen across several departments: enrollment, academics, facilities, finance. But the key department where planning decisions translate into hard operational costs — transportation — is often the last to enter the conversation.
A change in student distribution, a program relocation, or even a small shift in scheduling can affect routing, driver availability, and total route count. Those operational changes are what ultimately add up in transportation costs.
Q2 is a helpful moment to pause and ask: What do these decisions mean for how students actually get to school?
District leaders don’t need to answer that question alone. This is where transportation teams provide valuable insight.
Are Enrollment Trends Matching What You Expected?
Enrollment projections guide early planning decisions, but by Q2 many districts start seeing whether those projections are holding.
Some neighborhoods may be growing faster than expected. Others may be stabilizing or declining. Your demography department may already be tracking these shifts. Even modest changes in student distribution can affect route density and transportation demand.
District leaders should review:
Current enrollment compared to earlier projections
Population growth in specific neighborhoods or attendance zones
Changes in projected riders by school
Whether route density is increasing in certain areas
Looking at these trends now allows transportation teams to rebalance routes thoughtfully rather than reacting closer to the start of school. At School Bus Logistics, we’re working with districts in Q2 to conduct boundary analyses, bell time studies, and route optimization evaluations.
Opportunities to Improve Route Efficiency
This is the time of year when transportation teams begin noticing patterns in the system. Certain routes may overlap. Some buses may be running below capacity. Other routes may be longer than necessary because systems have evolved over time.
These operational details are easy to miss in broader planning conversations, but they’re important areas to consolidate and save valuable budgets. Even deterring the need for one additional route can save districts $150,000 annually.
Here’s where your savings live:
Routes that overlap in dense areas
Buses consistently running below capacity
Opportunities to consolidate or rebalance routes
Stops that may need adjustment based on updated rider counts
Include Transportation in Leadership Planning
Too often, we see transportation departments get asked to implement plans after key decisions have already been made — without them in the room. But when transportation leaders are included earlier in planning conversations, districts often gain valuable operational insight before plans move forward.
Considerations for distinct leaders:
Is the transportation director included in administrative planning meetings?
Are transportation implications reviewed before major decisions are finalized?
Are transportation teams given time to evaluate proposed changes?
Are departments coordinating when decisions affect routing and schedules?
Evaluate the Student Transportation Experience
Transportation planning often focuses on logistics and cost, but it also shapes the daily experience of students. For district leaders, it can be helpful to occasionally step back and ask how transportation policies affect the school day.
Questions worth reviewing include:
How long are students spending on the bus each day?
Are certain schools or grade levels experiencing longer travel times?
Are elementary students spending excessive time on buses?
Are there opportunities to improve travel times through routing adjustments?
In some districts, younger students may spend close to two hours on the bus each way. Situations like that often develop gradually as systems evolve. Reviewing these patterns now gives districts time to explore improvements before next year’s plans are finalized.
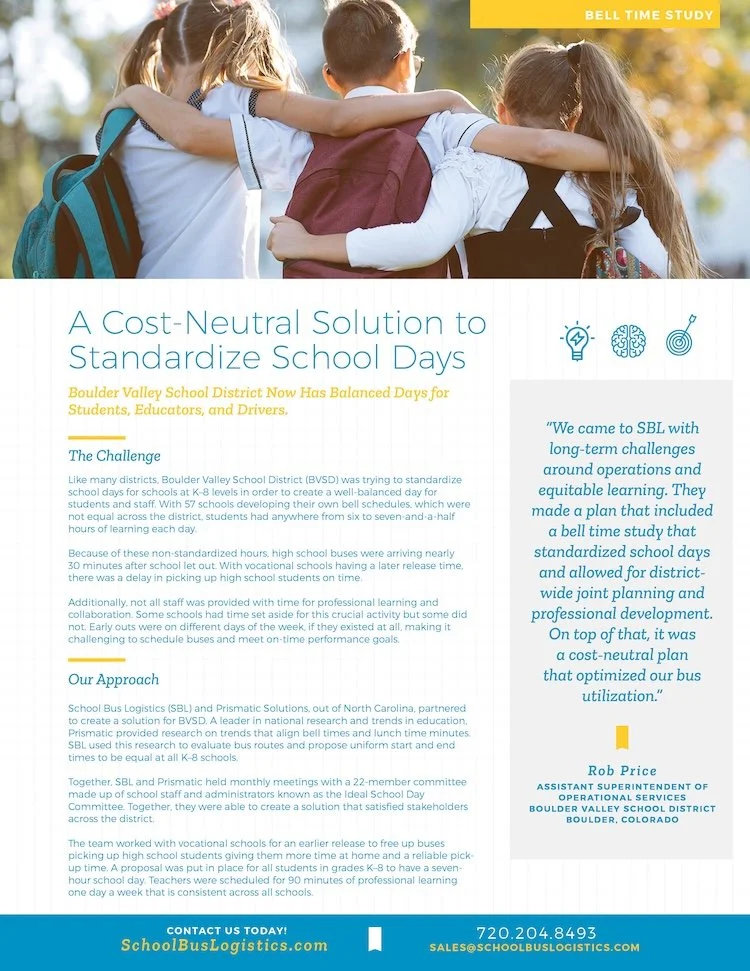
CASE STUDY
Read about how we helped Boulder Valley School District improve their operations and ensure students had equal instructional time.
How SBL Helps Districts
School Bus Logistics supports district leaders during their planning process. Through route efficiency studies, bell time and tier modeling, cost-per-rider analysis, and long-range fleet planning, we help districts see how operational choices affect transportation budgets and daily service for students.
If your district is planning for next year and wants a clearer picture of transportation budget impacts before decisions are set, we’re here to help.